Austin, TX
Ride-Hailing Analysis
Comprehensive EDA, ML modeling, and cross-city insights from 910,522 cleaned ride records (June 2016 – Feb 2017)
Exploratory Data Analysis
Click any chart to expand • 11 visualizations from 910K+ records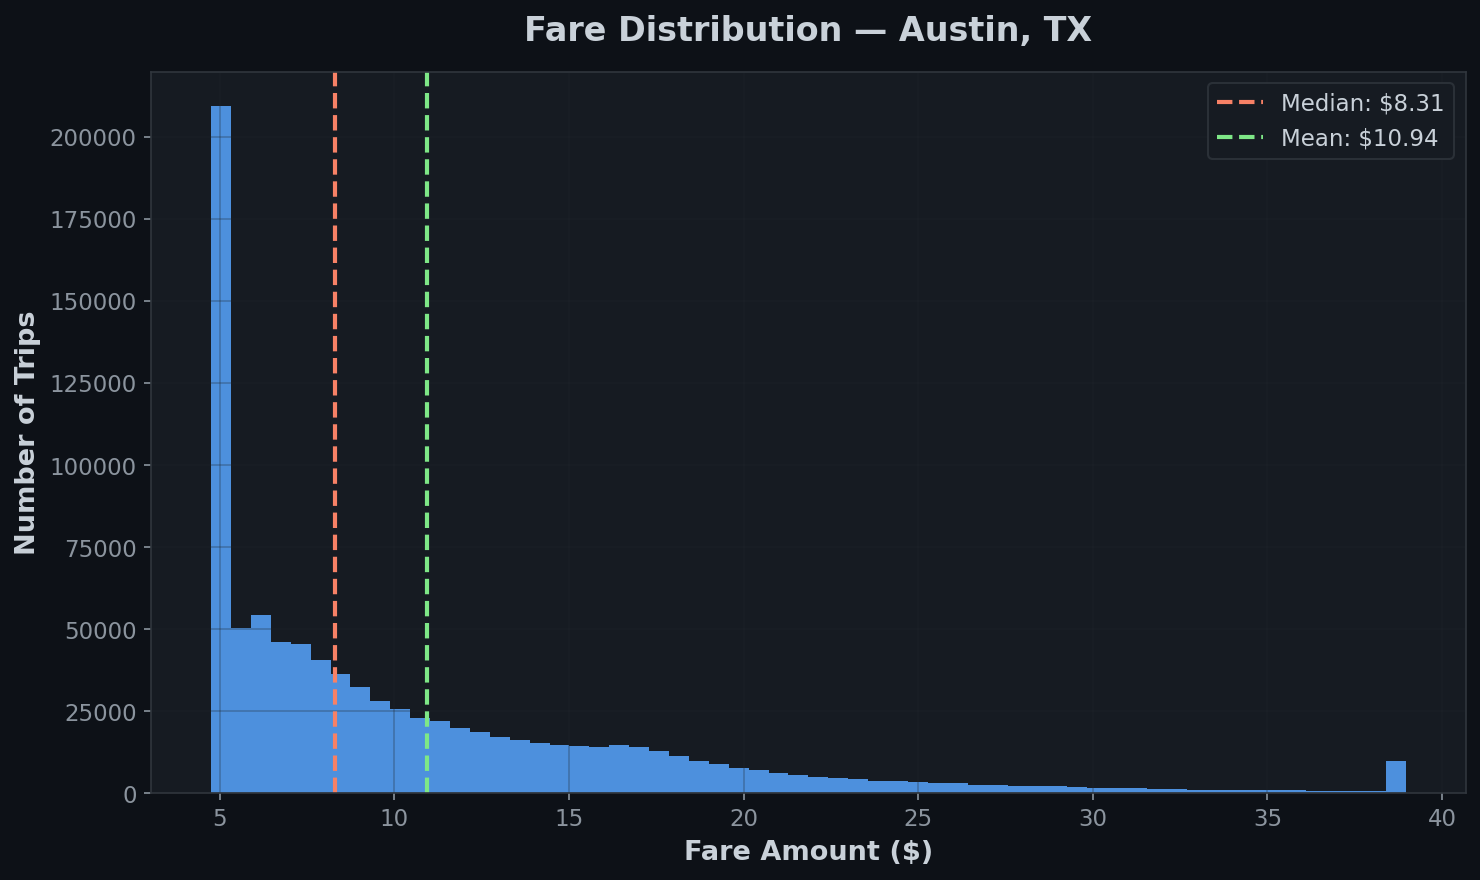
Interactive Data Explorer
Filter and drill down into 910K+ recordsHourly Ride Demand INTERACTIVE
Rides by Day of Week INTERACTIVE
Fare Distribution by Category INTERACTIVE
Machine Learning Models
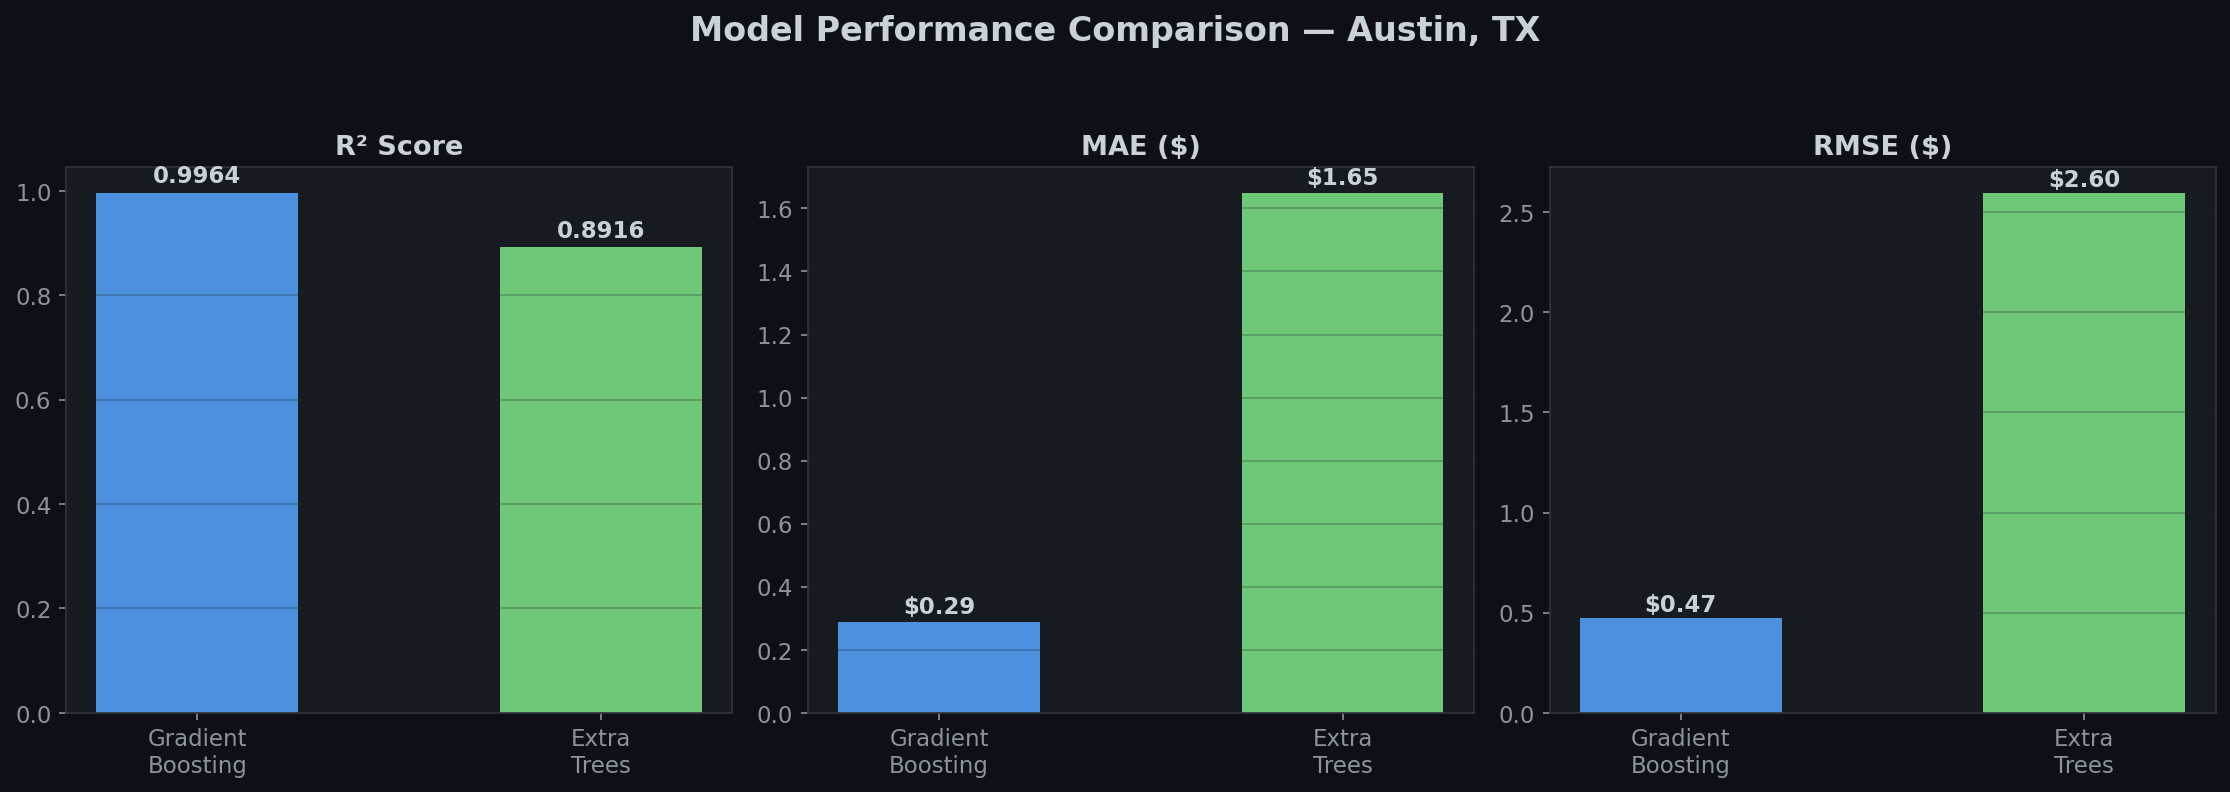
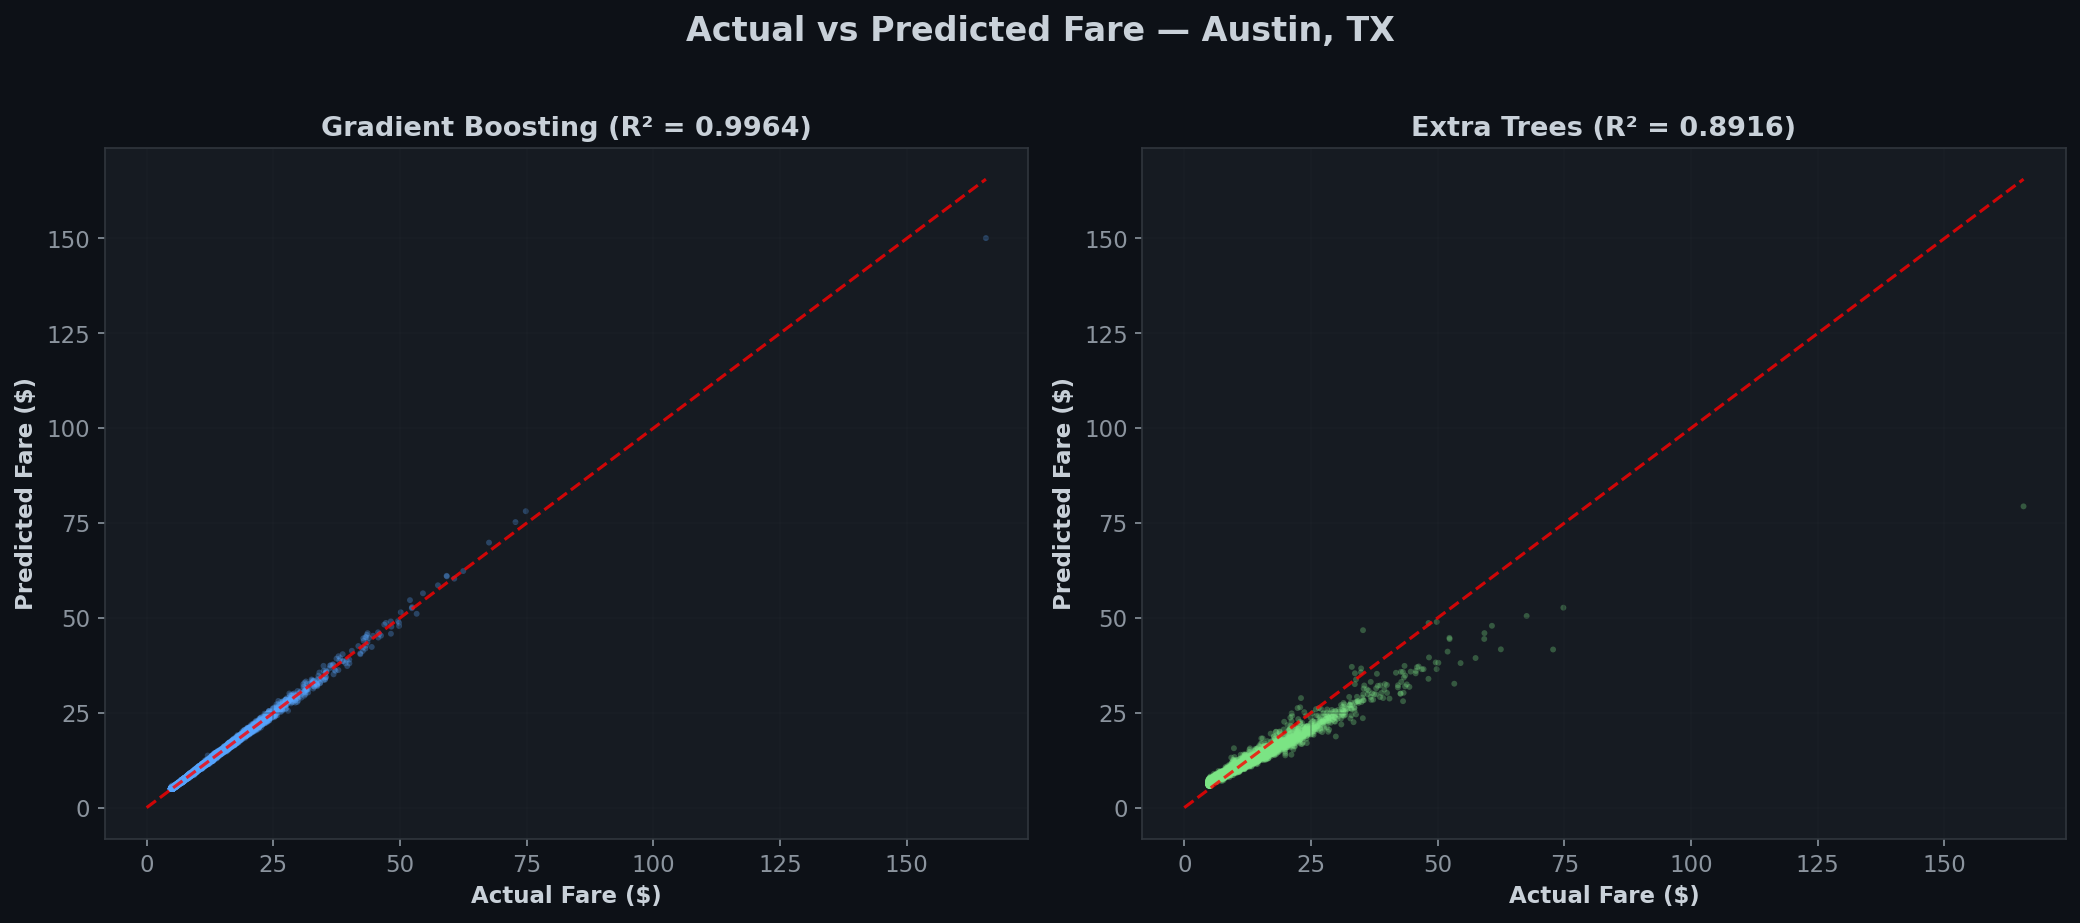
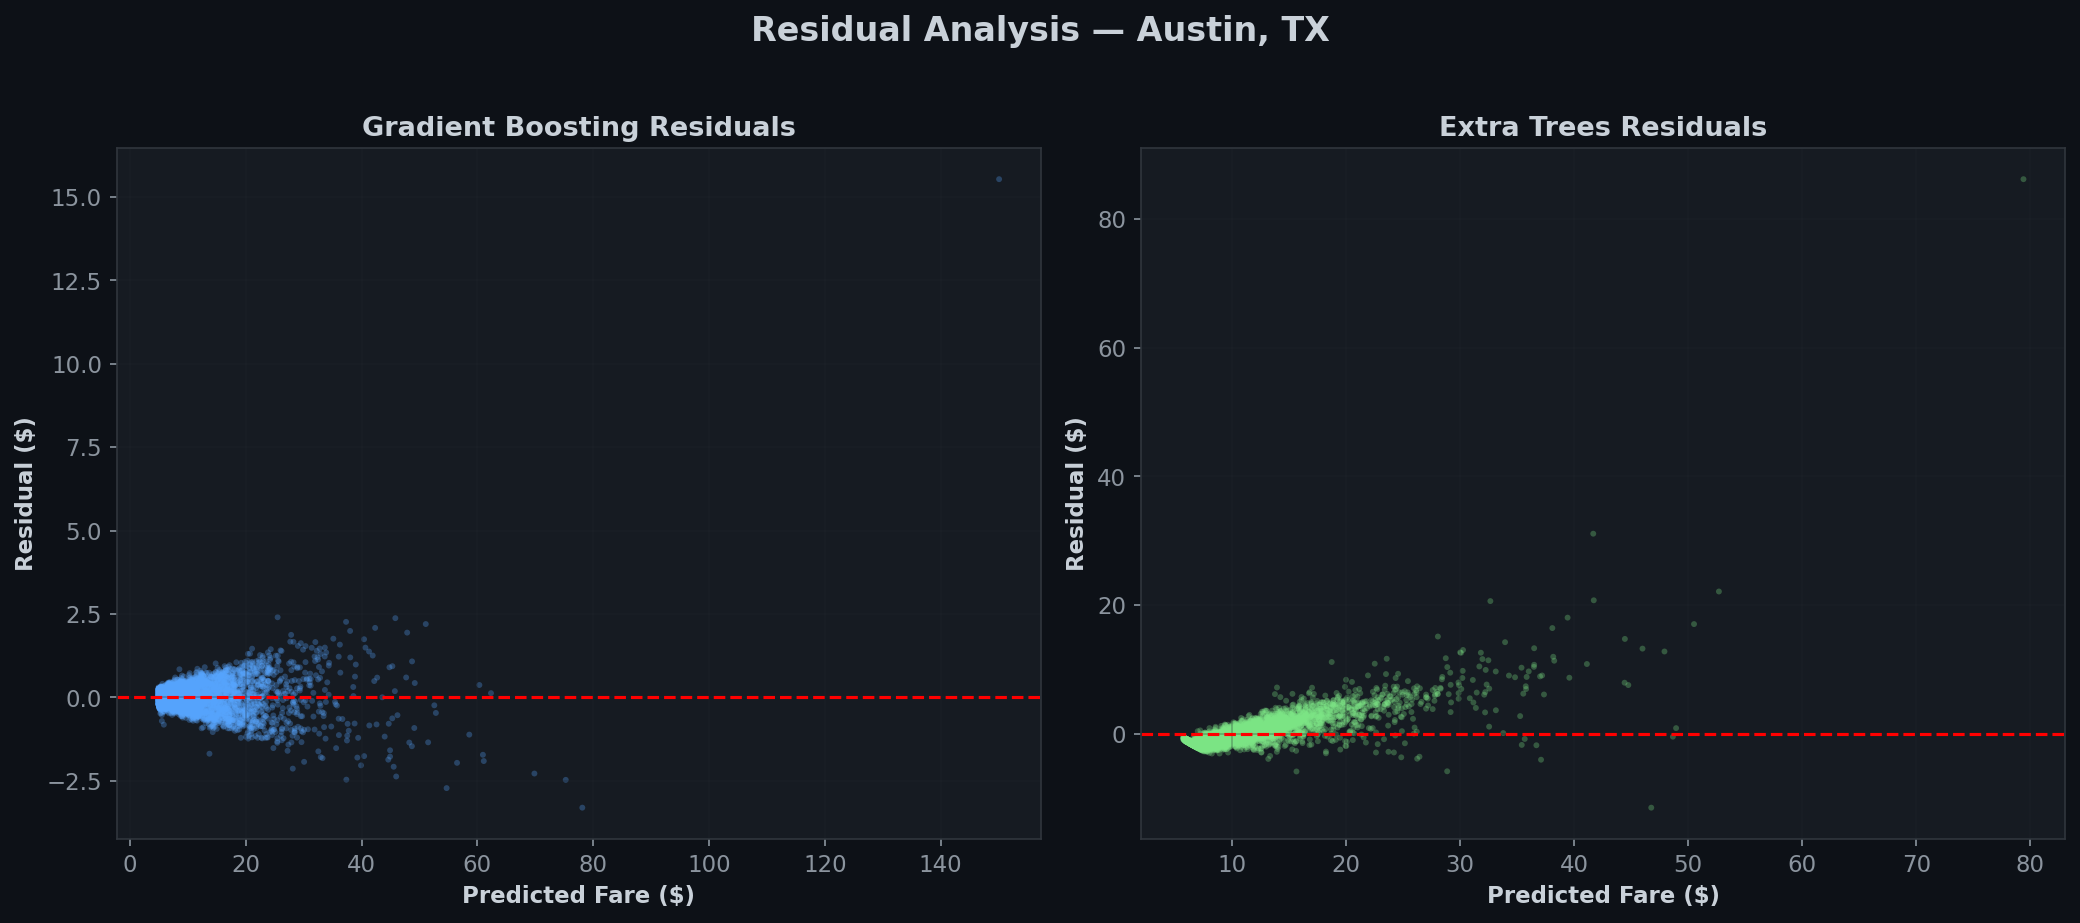
Fare prediction — 13 features| Model | R² Score | MAE ($) | RMSE ($) | Status |
|---|---|---|---|---|
| Gradient Boosting Regressor | 0.9964 | $0.29 | $0.47 | 🏆 BEST |
| Extra Trees Regressor | 0.8916 | $1.65 | $2.60 | Baseline |
Key Business Insights
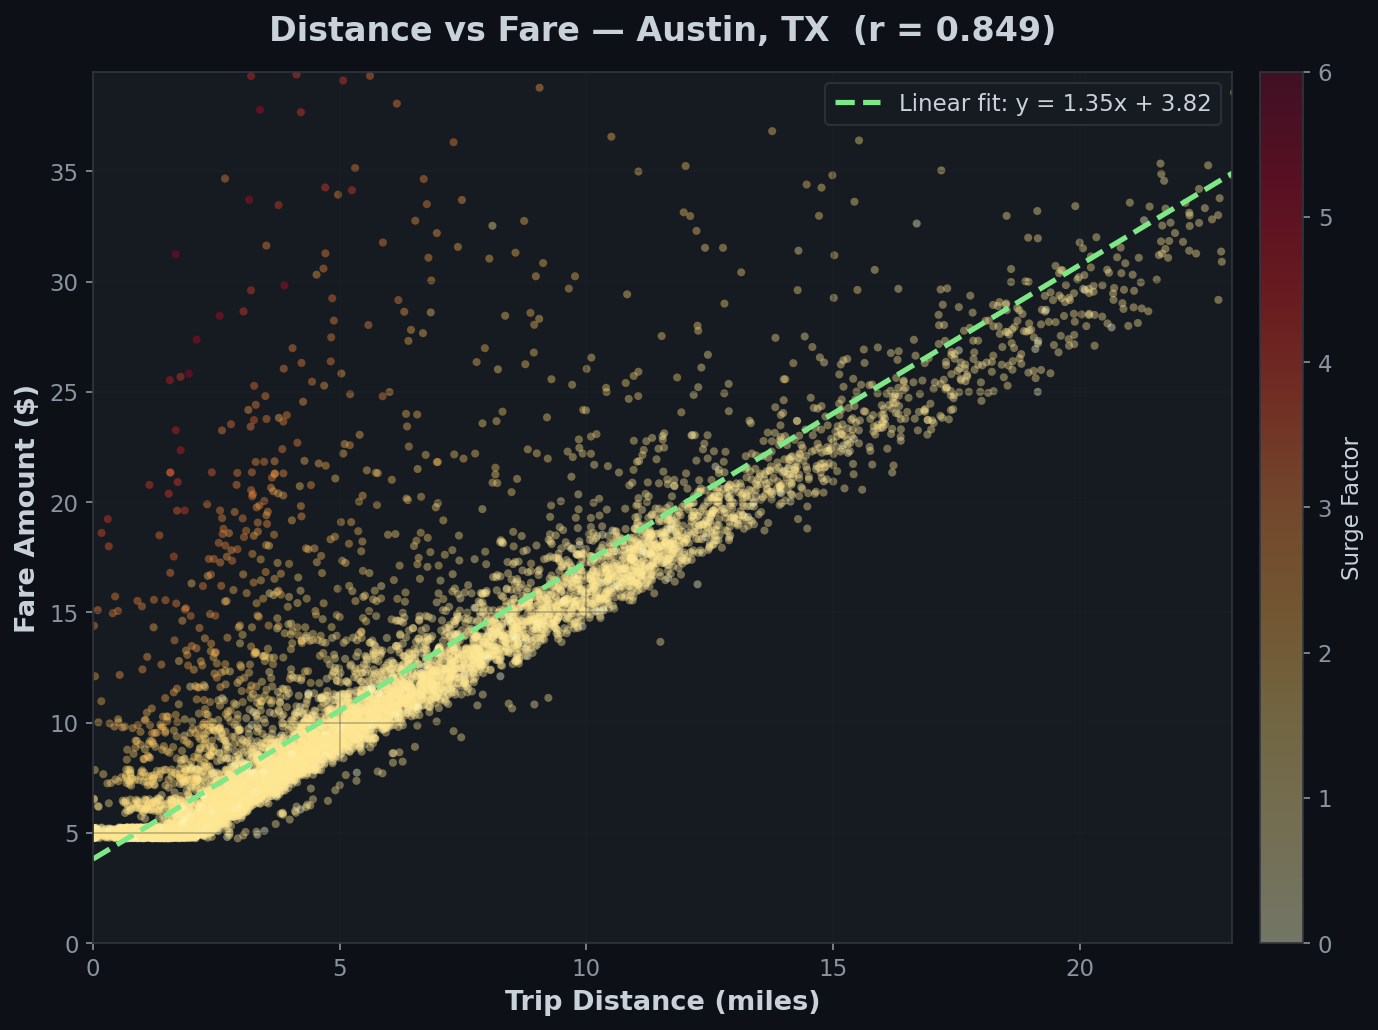
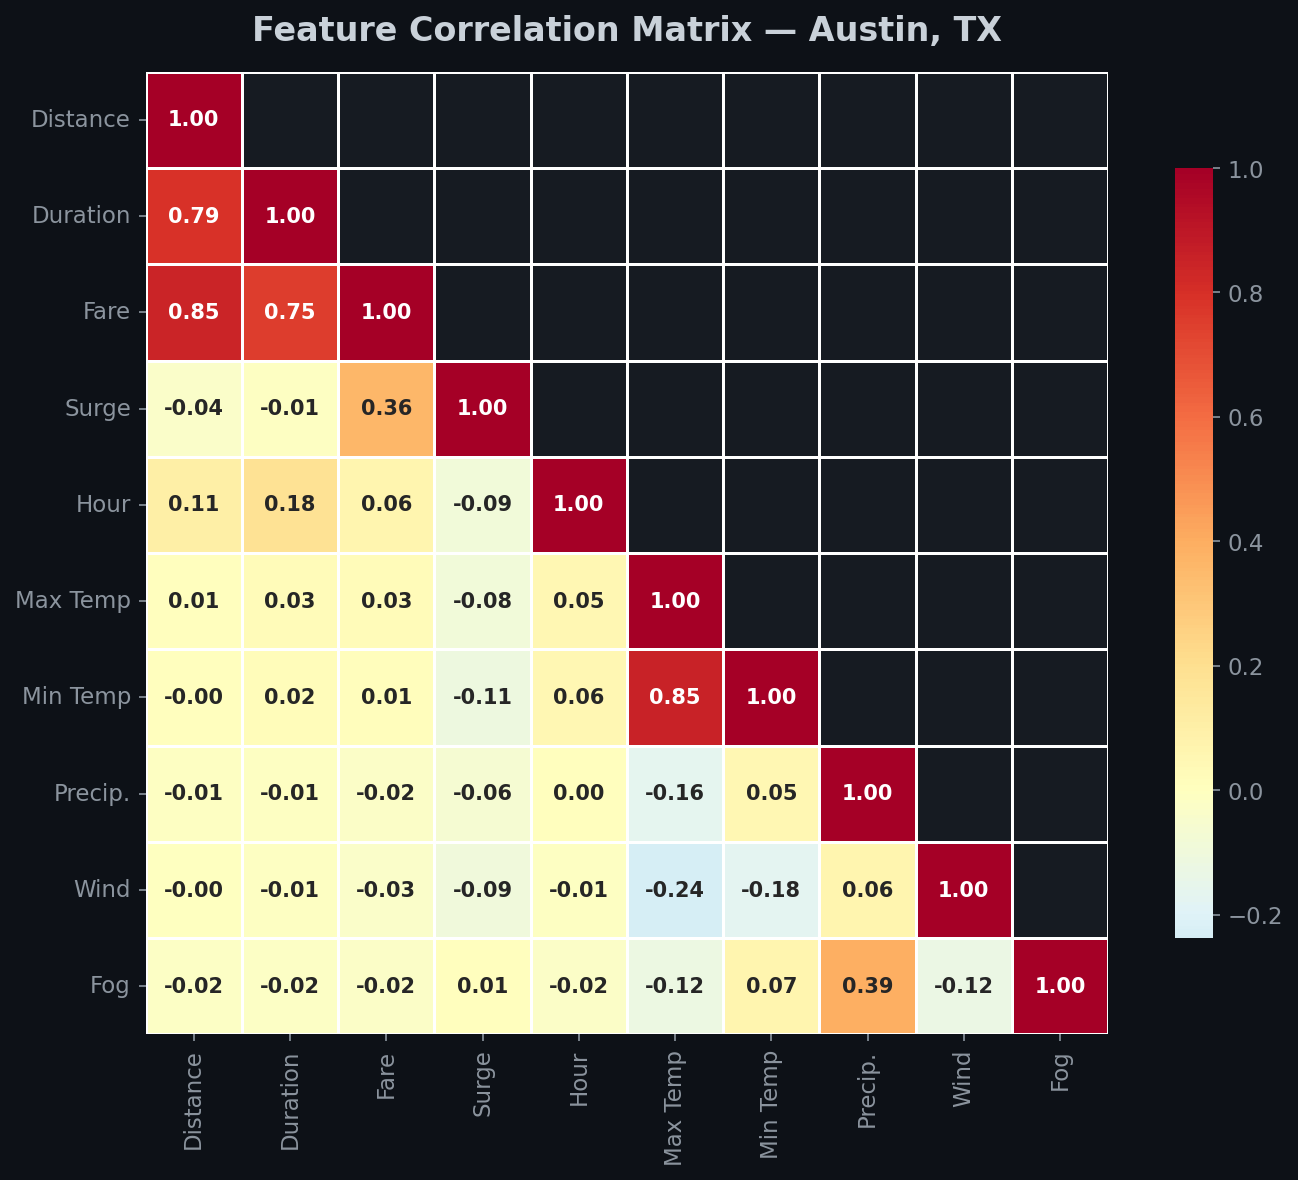
Distance Drives Pricing
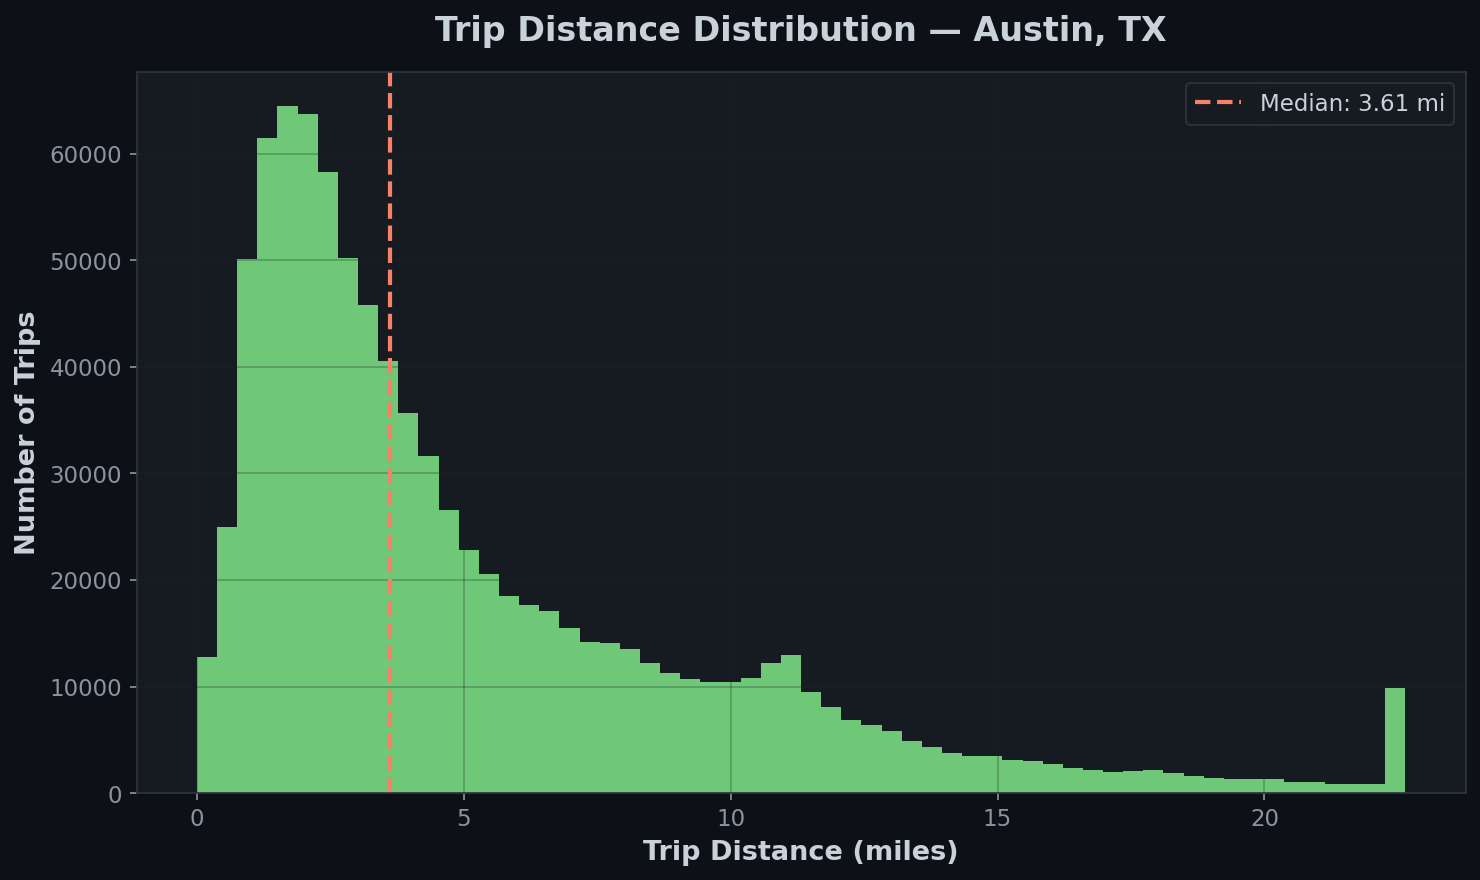
Trip distance is the strongest predictor of fare (r = 0.849). A linear relationship explains ~72% of fare variance before considering other features.
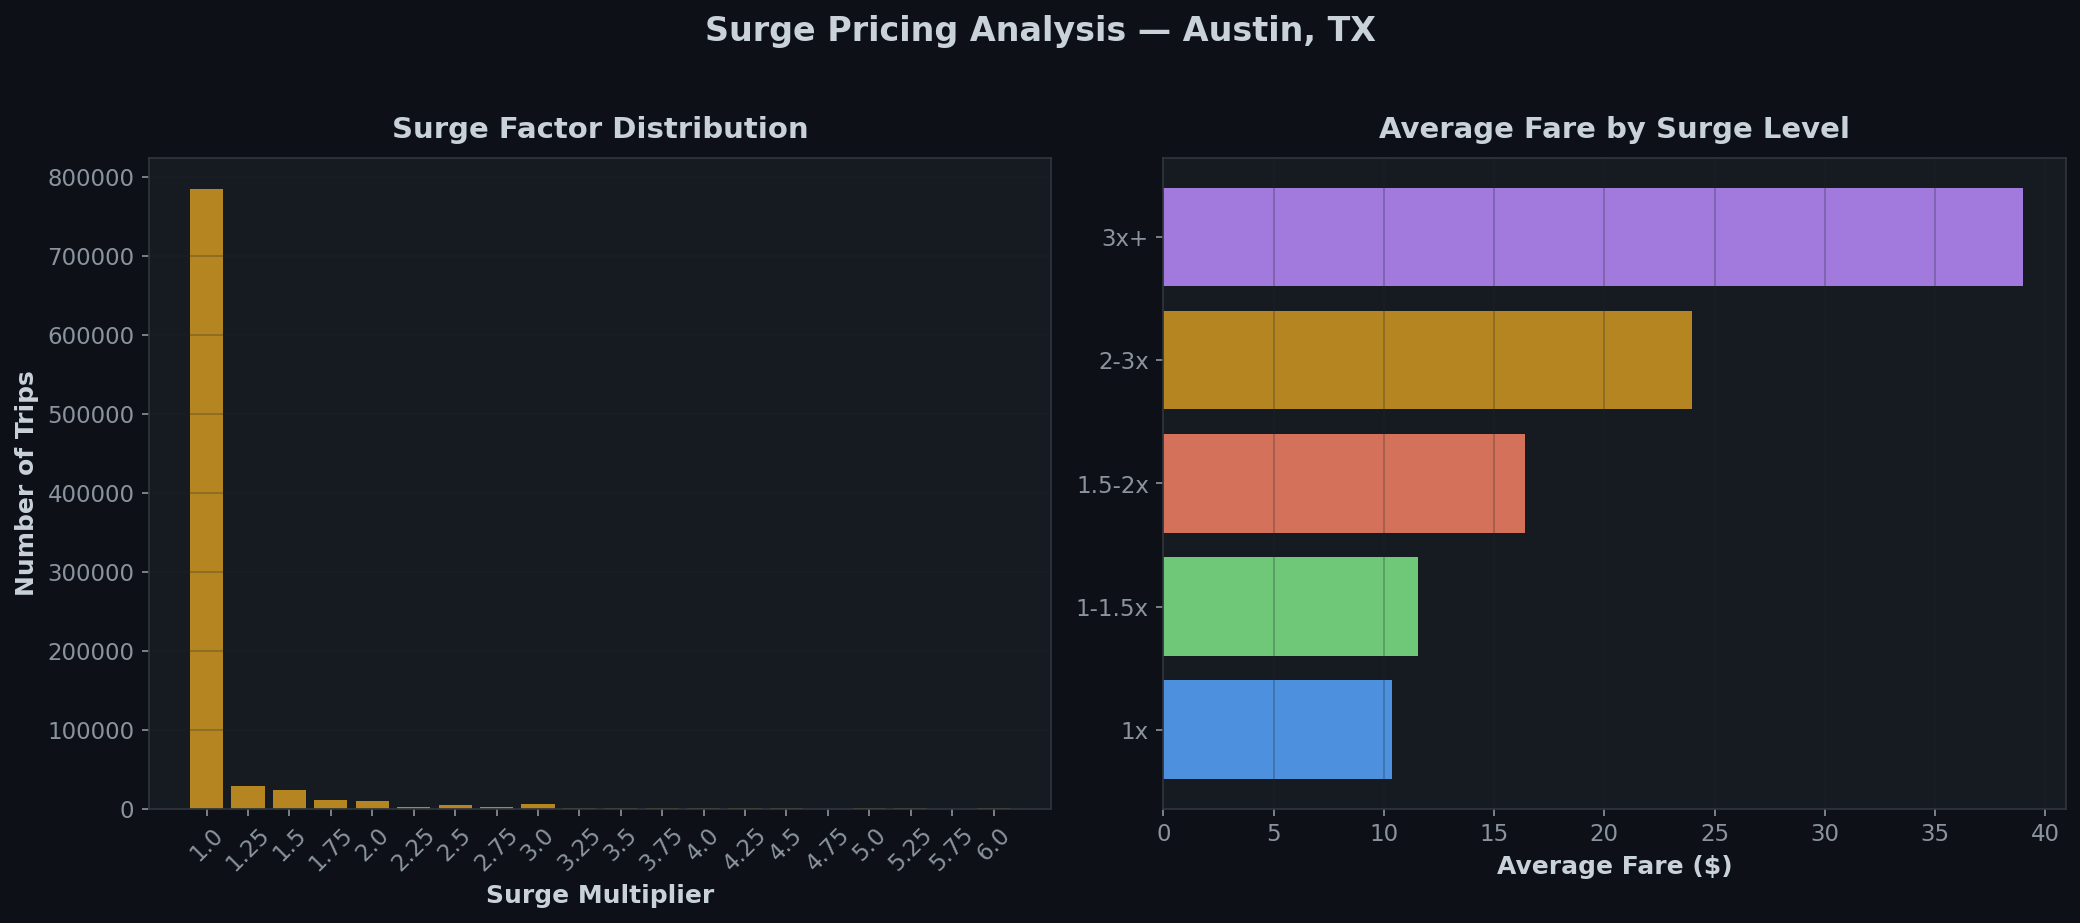
Surge Pricing Volatility
10.2% of rides experience surge pricing. At peak surge (6x), fares increase by up to 500% — reflecting acute demand-supply imbalance during events and late nights.
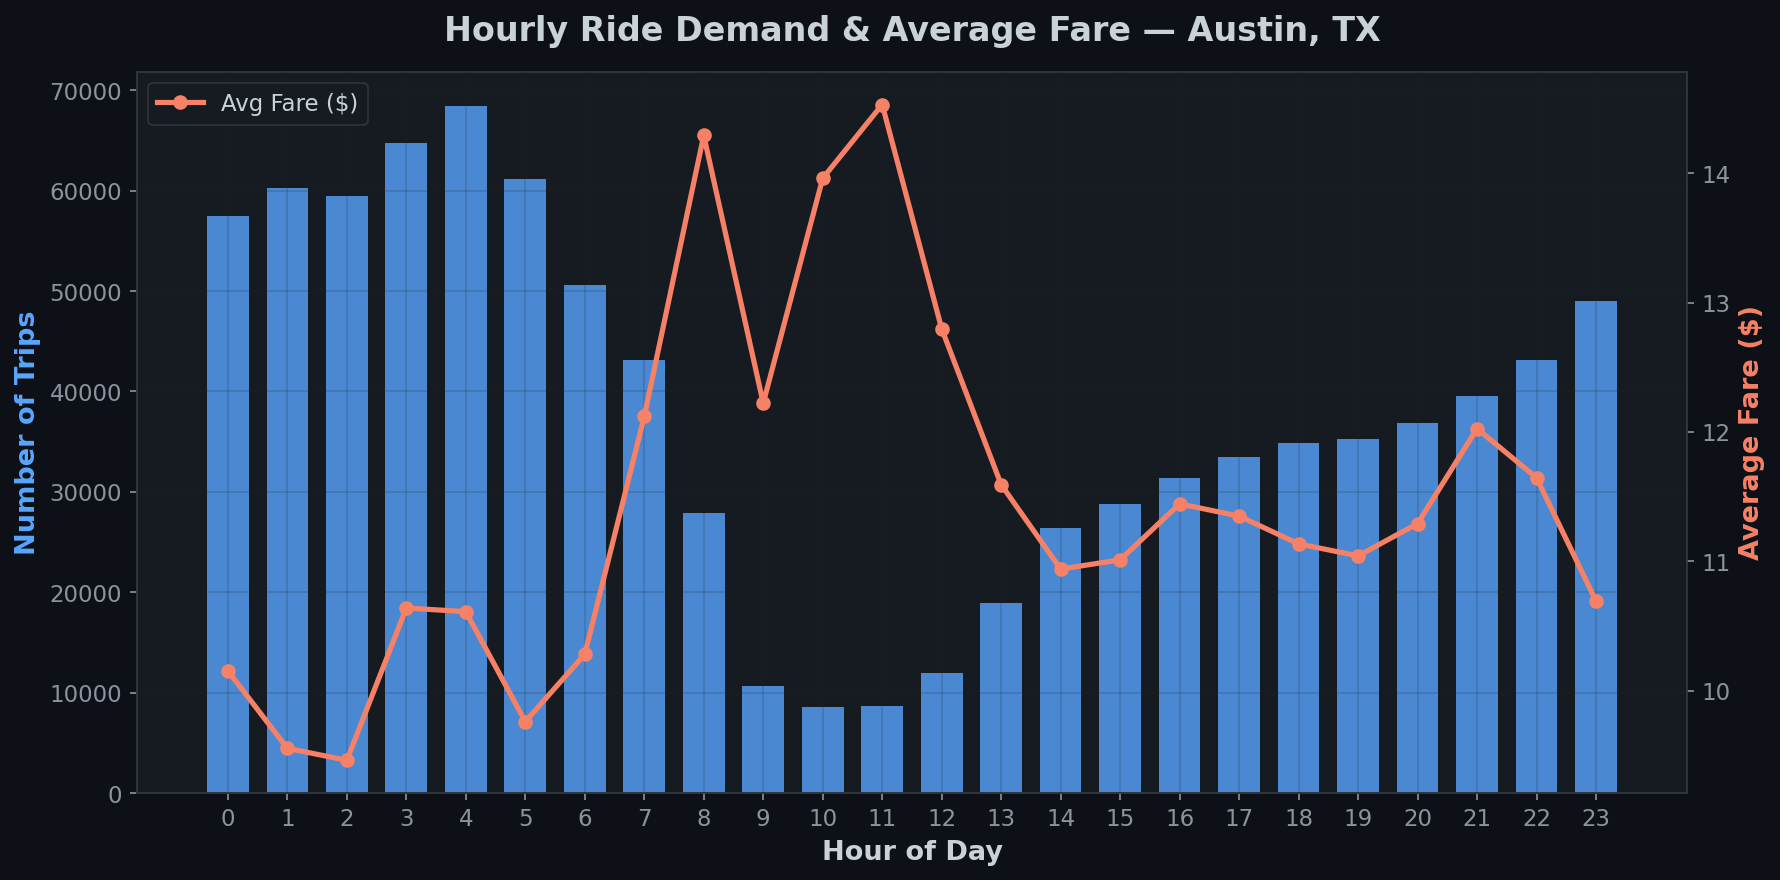
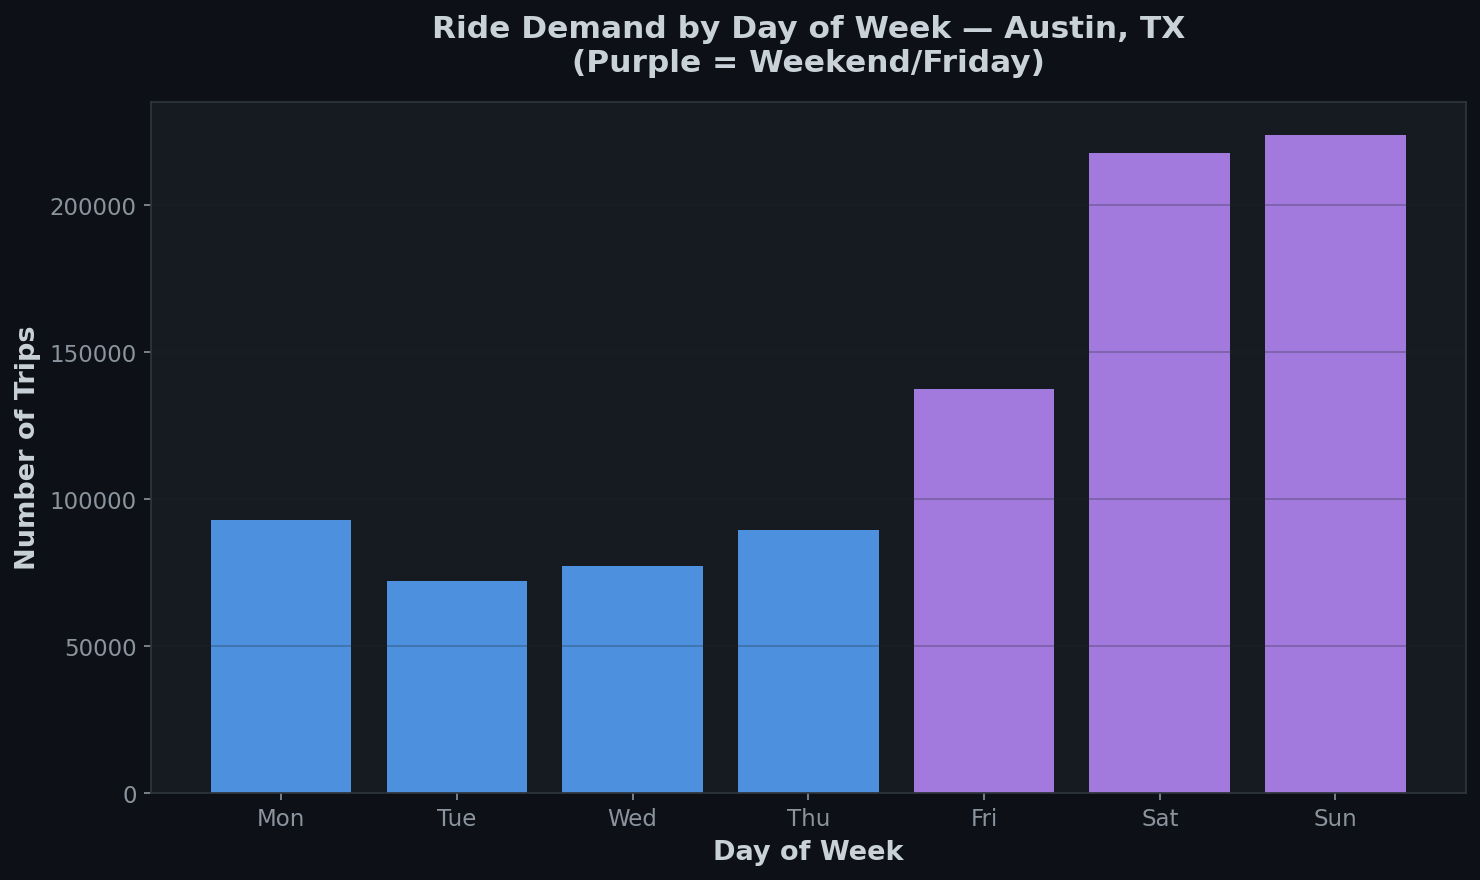
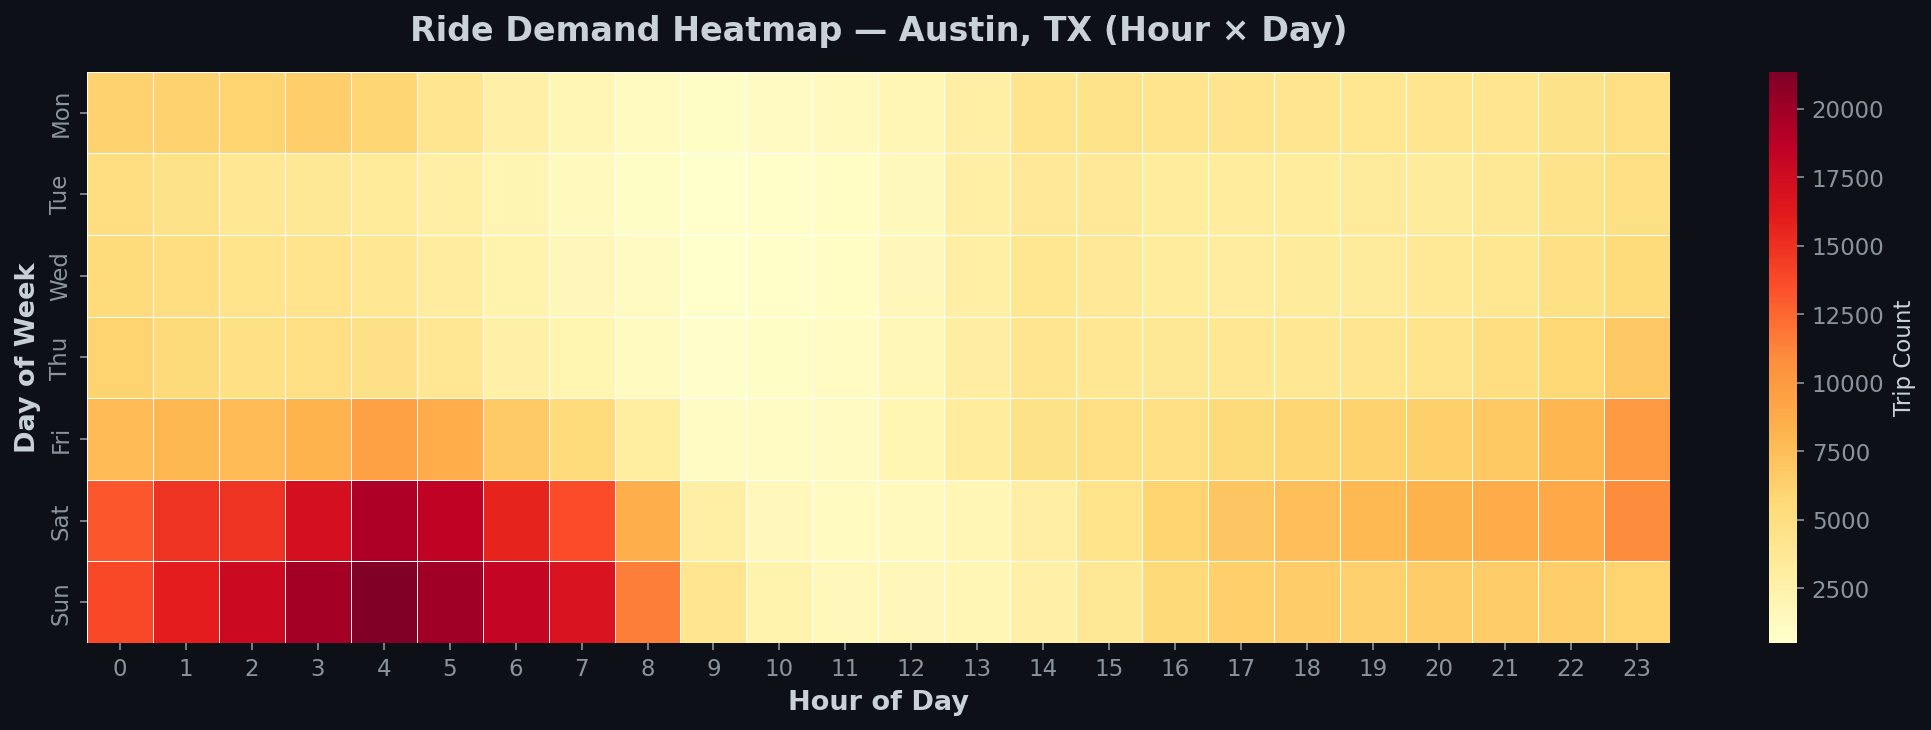
Late-Night & Weekend Peaks
Demand peaks around midnight–2AM (nightlife) and early morning (4AM). Sunday is the busiest day, indicating Austin's vibrant entertainment district driving ride-hailing usage.
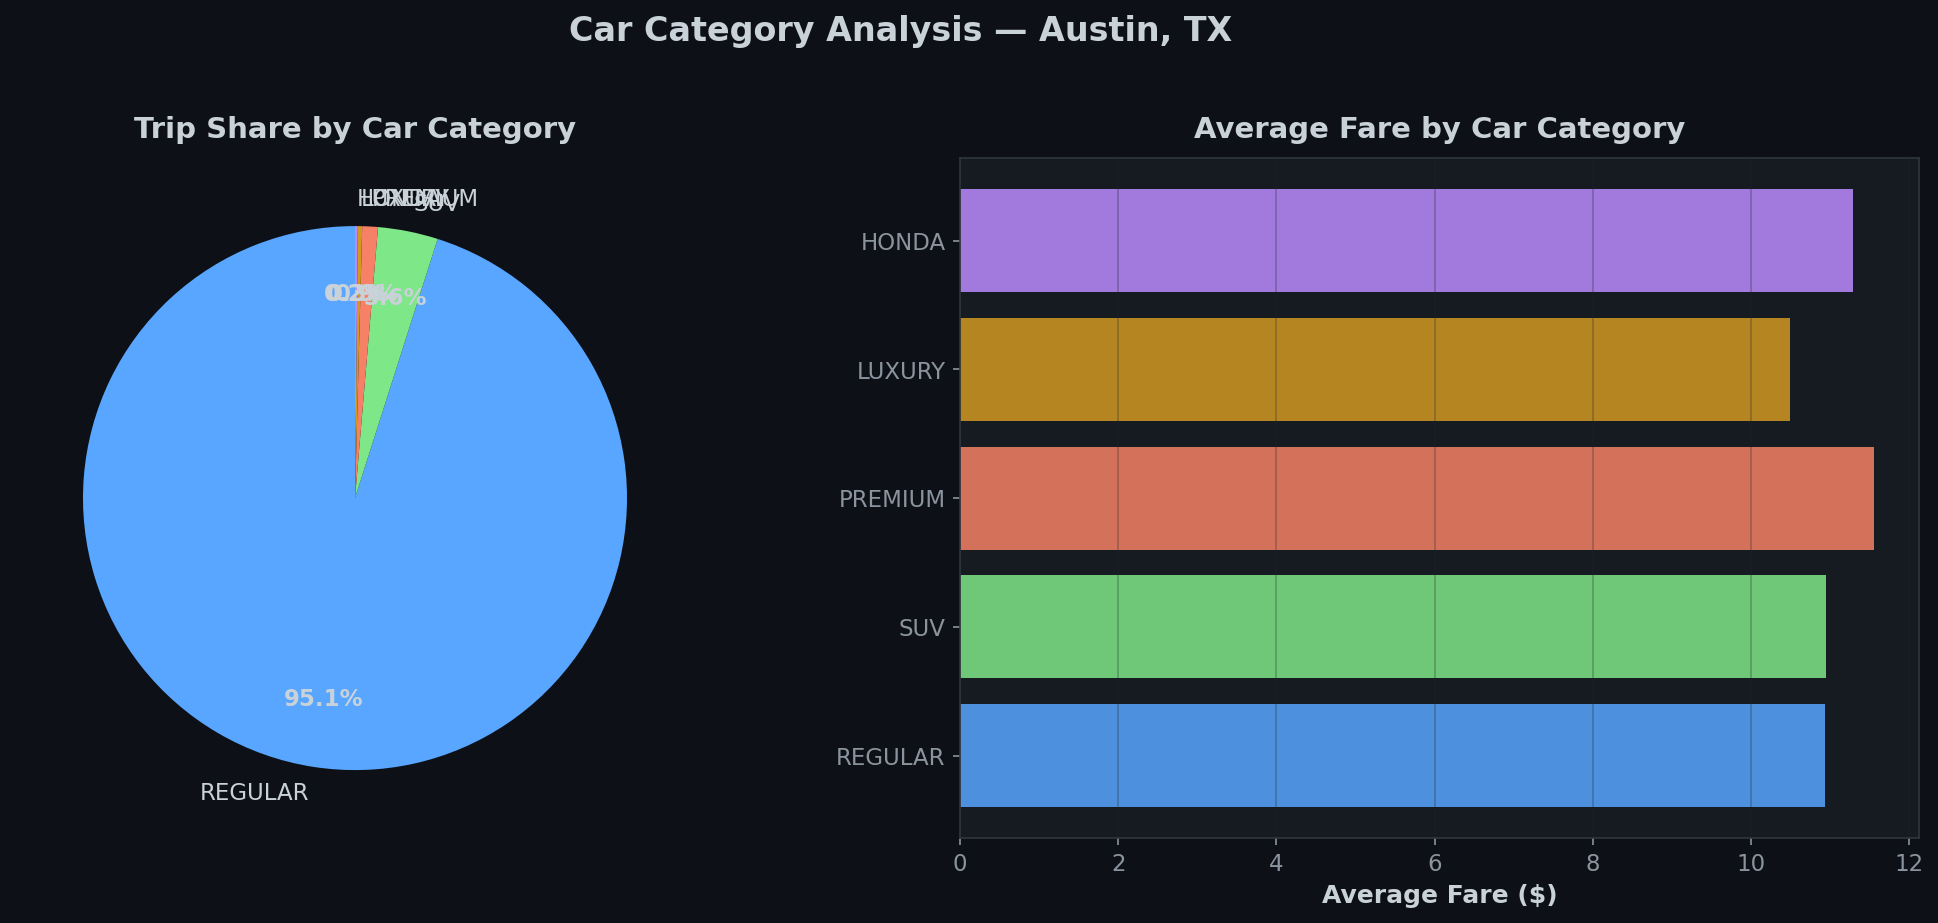
Vehicle Category Premium
95.1% of rides use REGULAR category. SUV and PREMIUM categories command 15-40% fare premiums, suggesting price-inelastic demand for premium services.
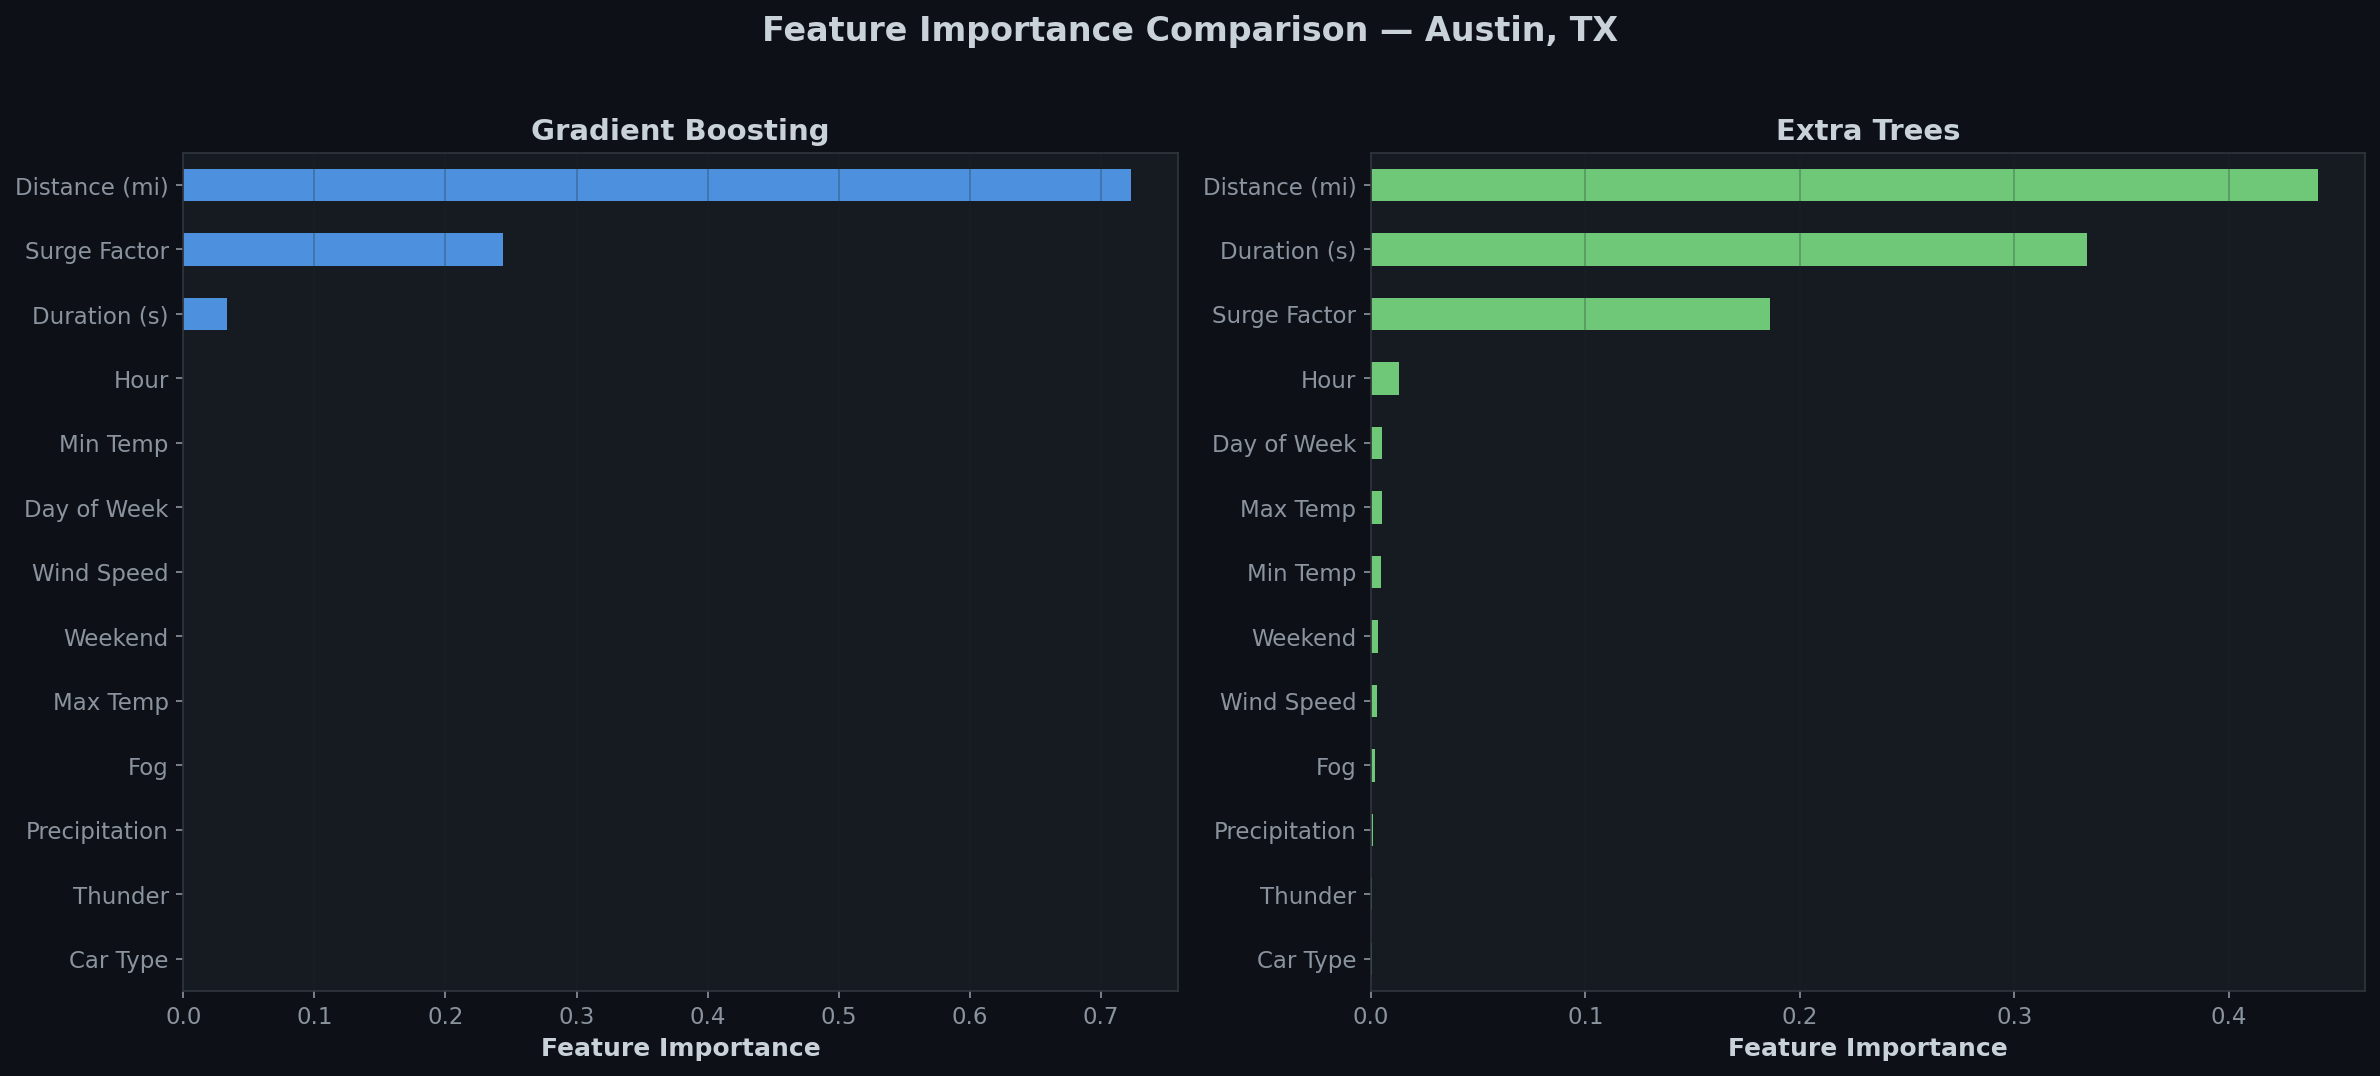
ML Predicts with 99.6% Accuracy
Gradient Boosting achieves R²=0.9964 with just $0.29 MAE. Duration and distance are the top features, while surge factor and time-of-day introduce non-linear effects captured by ensemble methods.
Cross-City Comparison
Austin vs NYC, Chicago, DC, San Francisco🗽 Austin vs NYC
- Austin has significantly smaller scale (~910K vs millions of HVFHV trips)
- Austin surge impact is relatively stronger (up to 6x vs NYC's more regulated pricing)
- Less congestion-driven pricing than Manhattan's grid-based patterns
- Austin's nightlife-driven demand pattern contrasts with NYC's commuter peaks
🏙️ Austin vs Chicago
- Chicago's transit integration creates more linear pricing
- Austin is more demand-driven with entertainment-focused spikes
- Both show strong distance-fare correlations
🏛️ Austin vs Washington DC
- DC showed distinct tipping patterns not present in Austin
- Austin's surge-driven pricing is more volatile than DC's steadier fares
- DC's Metro proximity creates alternative transport competition
- Austin's sprawling layout leads to longer average distances
🌉 Austin vs San Francisco
- SF's tech-heavy early adoption contrasts with Austin's emerging market
- Terrain differences: SF hills vs Austin flat terrain affect routing
- Both cities show strong tech-driven demand patterns
- Austin's entertainment district creates more concentrated demand zones
Combined Dataset — 5 Cities
| City | Records | Share |
|---|---|---|
| 🏛️ Washington DC | 2,574,807 | 63.5% |
| 🤠 Austin, TX | 909,830 | 22.4% |
| 🗽 New York City | 199,957 | 4.9% |
| 🌉 San Francisco | 191,128 | 4.7% |
| 🏙️ Chicago | 179,205 | 4.4% |
| Total Combined | 4,054,927 | 100% |